Next drop lundi, Nov 9 at 9 après-midi ET See what's new

Executive Sales Report

Cannabis sales reporting for your whole portfolio

Review your portfolio's retail performance by channel, brand, rep, geography and category, down to individual accounts, stores and products, with prior-period and year-ago comparisons and presentation-ready charts.

  • Un sommaire, puis des découpages par province, canal, catégorie, marque et représentant
  • Gains et pertes réels sur 21 jours, plus les onglets Concurrence et Vente en gros
  • Ventilez les canaux par segment personnalisé et exportez n'importe quel graphique pour la direction
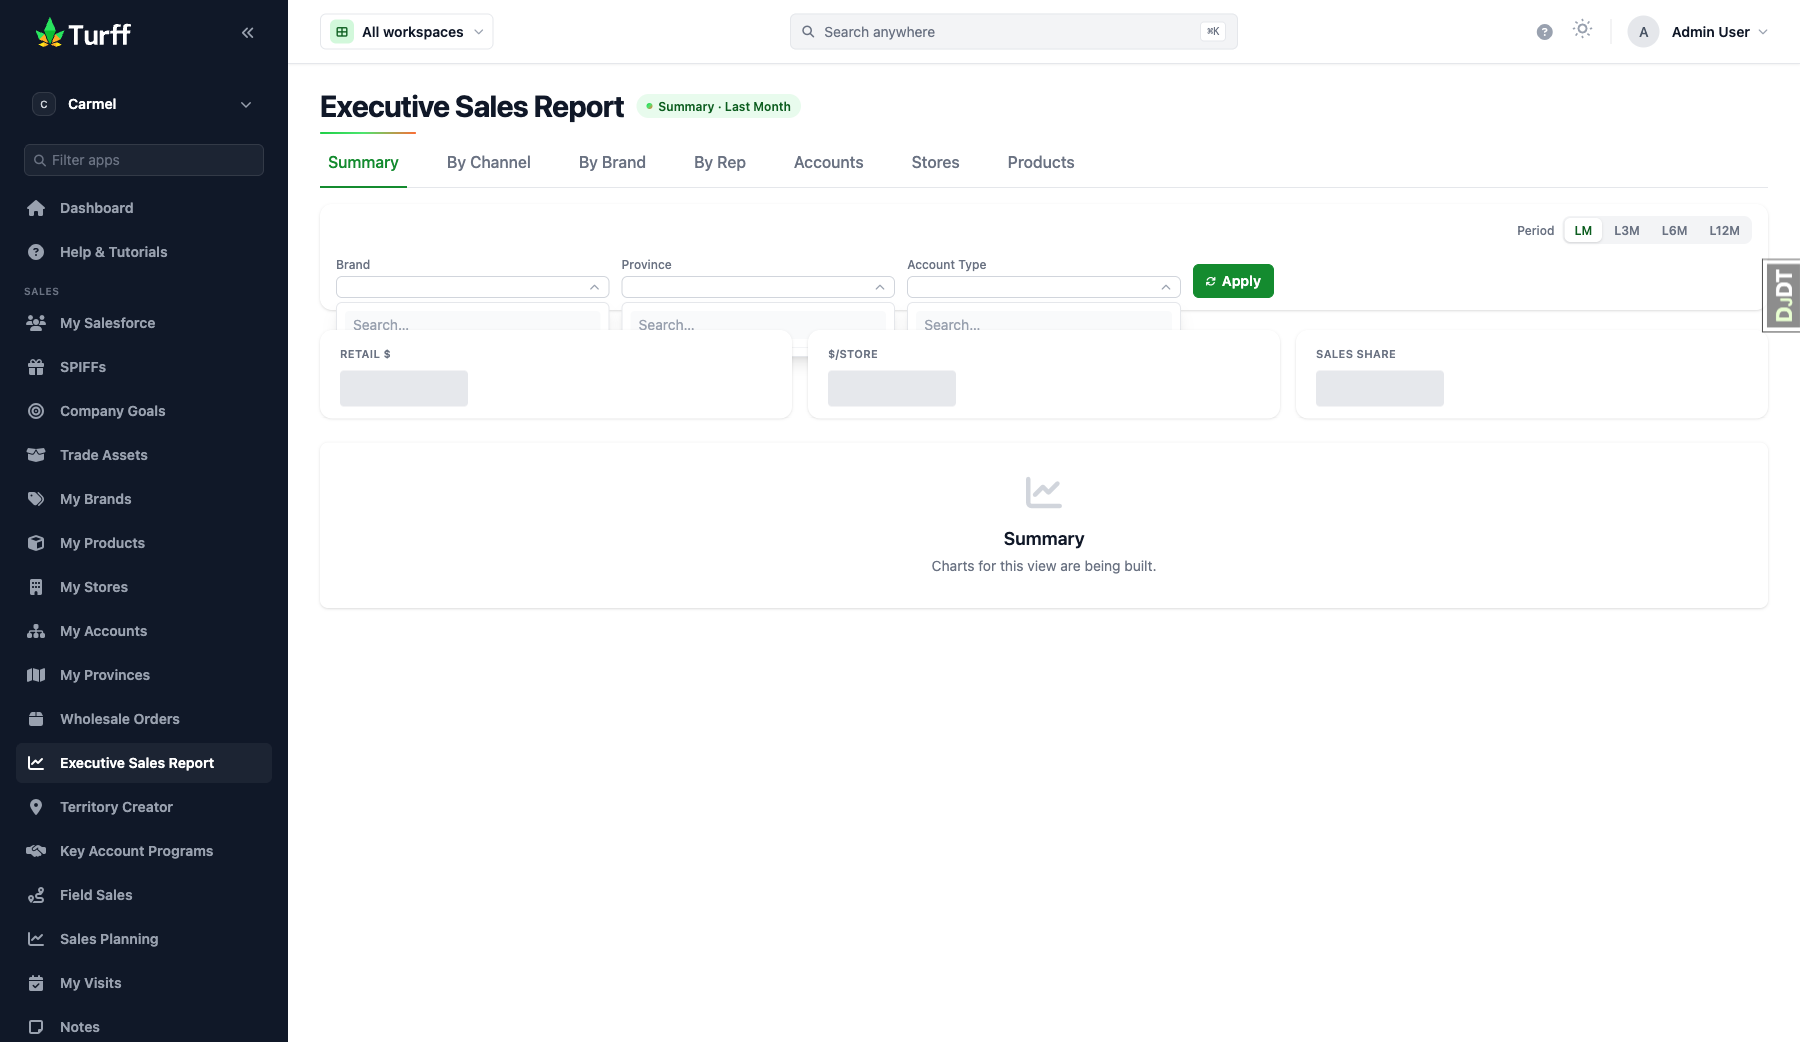
Executive Sales Report

How it works

The whole portfolio on one tab
The Summary pairs the headline KPIs with a portfolio trend, Retail $ by province on a map, your top brands and products, and the biggest movers.
Prior period and year ago, built in
Every view covers complete calendar months and compares them with the equal-length period before and the same months a year earlier.
Ready for the leadership meeting
Expand a chart into a full-screen view with a dynamic title and value labels, then export it as a PNG.
Saved views for the team
Save your filters and period as a view, star one as your landing default and share it with your team.

More sales tools

All sales tools

Voyez-le en action

Réservez une démo pour voir comment nos outils Ventes peuvent travailler pour votre équipe.